 Image: Fernando Garcia on Flickr. Since 2010 I've supervised MSc students in their fourth and final semester, where they design, research, write, and defend a Master's Thesis in Sustainability Science. Tomorrow I'll meet my new batch of students for the first time, and we'll make a plan for working together in the coming semester.
First meeting agenda:
Helpful resources for your thesis research: Here are guides I've written over the years that I hope can help you get started or make the thesis process a bit less overwhelming. Research design
Good luck, thesis writers! You can do it!
In other words, you don't start out deciding to do a survey, then looking for appropriate research questions to ask and attendant philosophies and theories. For a simple breakdown of how philosophy of knowledge, theory of knowledge, and research style combine to produce research programs, see our 2010 article "Thinking about Knowing"- this could help you write the dreaded "philosophy and theory" sections of a master's thesis, for example.
Another useful resource is this overview of qualitative research in conservation by Moon et al. 2016, including a helpful list of questions in Table 5 that will help you avoid many common pitfalls. 2. What are the research questions you want to answer? It is essential that you have a manageable number (i.e., not more than three) clearly articulated research questions that guide all further research design. Coming up with a good research question is an art in itself (take a look at The Craft of Research for a whole chapter on how to do this). In short, my view is that a good research question is grounded in a real-world problem, linked to other research and/or theory in the field, specific enough to be answerable with the resources you have available, and something you are passionate about answering. 3. Are surveys the appropriate method to answer your research questions? Be sure to consider alternatives and convince yourself that surveys are a good way forward, that will help you answer your research question. If you can directly observe behavior or use existing data to answer your question, that will be easier than designing and carrying out a good survey. On the other hand, if you need to know how people think (attitudes) or feel (values) about something, then you need a survey to ask them directly to find out. 4. Who is your target population, and how will you sample from them? Consider that your sampling design will affect the validity and generalizability of your conclusions (i.e., if you want to do inferential statistical analysis to draw conclusions about significance, you need a random sample that is large enough to be representative). William Trochin has a good, concise overview of sampling and social research design issues on his Research Methods Knowledge Base. Issues to consider here include how you identify the target population (what characteristics must they have?), and how you identify them (what criteria will you use to include or exclude participants, and how many do you seek?). Write down all your criteria in your Methods section under Sample Selection. 5. How will you design your survey? Here's a really nice, simple, clear overview of best practices for survey research design by Kelley et al. 2003. This is a great place to start. Good tips on survey design, question construction, and administration in a book chapter from "Investigating the Social World" by Russell Schutt. 6. How will you analyze survey data? The simplest way is using descriptive statistics- e.g., graphing the distribution of the results in a histogram. A more complex way is inferential statistics- using statistical tests to draw conclusion about the likelihood of observations being due to chance, attributing numerical confidence to the results. This is a big topic; to get started, check out this guide from The University of Reading Statistical Service Centre on the analysis of survey data. For descriptive data (verbal or written textual responses to open questions), the aim is not to condense them into a number, but to use them to represent and explore different views. Here the process of coding can be helped with qualitative analysis software like NVivo or Atlas.ti. You will chose (and should state in your Methods) whether you are using inductive coding (themes emerge from the data) or deductive (trying to match responses to categories from previous literature or theory), or a combination. Whatever analysis approach you take, describe it clearly in your Methods, and explain why you chose it. 7. Research Ethics Conducting research with human subjects requires the researcher to take responsibility for considering and minimizing the risks presented to participants, and make sure that clear, prior, informed consent is obtained from your participants (this means your participants understand that their participation in the study is voluntary, they understand any risks that may be presented, and they know that they can end their participation at any time of their choice without penalty). You need to think about how you will protect the privacy of your participants and how to handle their data fairly and with what degree of anonymity. It is good practice to obtain written, signed informed consent before enrolling a participant (this might be ticking a box on the front page of an online survey, or initialing and signing a separate consent form including a copy for them for in-person interviews). Be aware that you are responsible for following ethical guidelines in the country where you conduct your research. In the US and Canada among other countries, completion of a formal course in research ethics and approval of a human subjects protocol is often required before conducting survey research. Here is the human subjects protocol I submitted to Stanford University for my PhD research in 2006- there are lots of helpful questions here to consider. And here is the consent form I used with my study participants. Feel free to use these as templates for your own research. Answers to the protocol questions can go in the Methods section of your thesis, and the consent form can be modified and used with your study participants. In Sweden, research should follow the Swedish Research Council Vetenskapsrådet's guide to Good Research Practice, with many useful areas to consider. Research conducted for a master's thesis generally does not require a formal application to the regional review board (meets monthly, costs 5000-16000 SEK to review applications, which must be in Swedish). Here is the Swedish law regarding research ethics, for research conducted in Sweden, that presents a sufficient risk or sensitive data. However, researchers still have a responsibility to follow good practices. Please be aware that you may be required to demonstrate good practices were followed and informed consent was obtained in order to publish your research results in a peer-reviewed journal. See below for two examples of text published in peer-reviewed articles describing how informed consent was obtained in Sweden. Text about informed consent: "Although the study scope exempted it from Swedish requirements for formal ethical review by an institutional review board, all procedures performed in this study involving human participants were in accordance with the ethical standards of the institution, and with the 1964 Helsinki declaration and its later amendments or comparable ethical standards. Prior, written informed consent was obtained from all individual participants included in the study (See consent form in S1).” --Source: Wynes and Nicholas, in second review Feb 2019, PLOS ONE "According to the Swedish regulations for conducting research on humans, there was no need to seek ethical clearance for this study. All participation was voluntary after informed consent, and the participants could withdraw from the study at any time. In order to protect the participants’ identity, revealing information has been removed from the results such as specific faculty, discipline, gender, ethnicity, and age. Furthermore, before data was analysed, all participants were invited to confirm their own interview transcripts and remove quotations that they did not want to share with others." --Source: Brodin & Avery, in press I hope these tips are helpful- happy research! Our new study shows trouble ahead for feeding the world under a warmer climate, with yields for staple grains declining more sharply with greater warming if high emissions of greenhouse gases continue. If emissions are reduced to the level represented by the current climate pledges at the start of the Paris summit (where carbon dioxide concentrations in the atmosphere stabilize around 550ppm), yields of corn in Iowa are projected to be similar to today (or even experience a slight increase of 6%). However, continued high emissions leading to greater warming would be expected to produce a 21% decline in yields. The news is worse for wheat yields in southeast Australia. This region already struggles with drought in a crop system that relies on rainfall, and climate models consistently project the area will get warmer and drier in the future. This combination spells potential yield declines of 50% under lower warming, and 70% under greater warming: extremely challenging conditions for continued wheat production in the region. 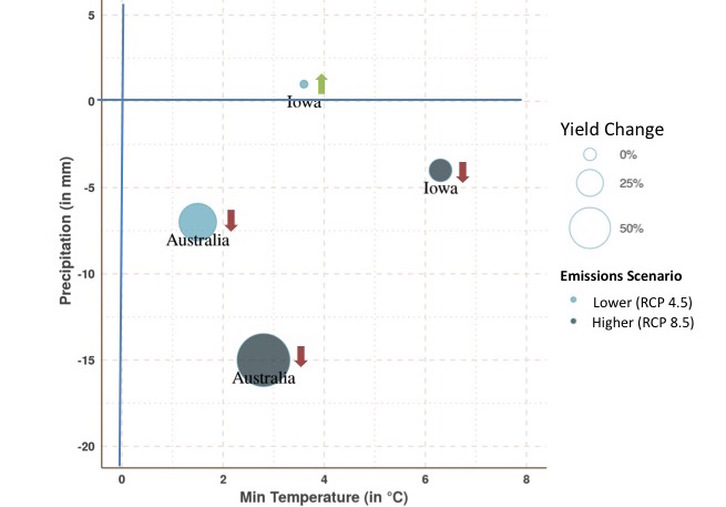 Average projected changes for temperature, precipitation, and yields for wheat in Southeastern Australia and maize (corn) in Iowa under two scenarios of greenhouse gas emissions. Under the lower scenario, maize yields in Iowa increase 6%, while they decline 21% under higher emissions. Wheat yields in Southeast Australia are projected to decrease 50% under lower warming, and 70% under higher warming, exacerbated by drier conditions in the future. Projections are for the end of the century (2070-2100) compared with a historical baseline (1951-1980). An interactive version of this figure, with results for each climate model and scenario, is available here. Figure by Martin Jung using data from Ummenhofer et al. 2015. The study, published in the Journal of Climate, found that yields of staple cereal were very sensitive to changes in climate. In particular, we found that, on average, each increase of 1°C (1.8°F) in temperature resulted in a yield decrease of 10% for corn in Iowa, and 15% for wheat in Southeastern Australia. This means that limiting warming through reduced heat-trapping pollutants is important to maintain the productivity of today’s breadbaskets. Both crops were also highly influenced by rainfall. Each decrease in precipitation of 10mm (0.39 inches) resulted in a yield decrease of 12% for Iowan corn and 9% for Australian wheat. Australia is predicted to experience substantially drier conditions in the future, which contributes to the large yield declines projected. In addition to average yields, we examined the conditions that produced extremely high and extremely low yields in the past, since weathering these extremes are important for farmers to maintain viability. Our analysis showed that, in the past, high yields of corn in Iowa tended to happen in particularly rainy years, with dry years spelling trouble for corn yields. Fortunately for Iowa, the changes projected for rainfall in the future are relatively small, with little difference between the higher and lower greenhouse gas emissions scenarios. However, the six computer models we used to simulate future climate make different projections, with half predicting a slight increase in rainfall (and therefore an increase in future good yields), while others predict somewhat less rain (and more tough years for corn). High yields of wheat in southeast Australia were also associated with wetter years in the past. Such years are consistently predicted to become less common in the future: all climate models and emissions scenarios agree in predicting a major increase in extremely bad years, where more than two-thirds of years will have yields 20% or more below today’s average.
The implications of this work are that increasing temperatures and rainfall variability from greater greenhouse gas emissions pose increasing challenges for agriculture. Research led by our colleague David Lobell has shown that this trend is already evident today: there has been a yield decline for cereal crops since the 1980s of 10% for every 1°C (1.8°F) warming. Many recent studies confirm the potential for yield declines for staple cereal crops under greater warming, especially for wheat. Different regions around the world are poised to experience climate change differently, and the risks depend on both the climate change experienced, and the human systems on the ground there. In the case of Iowan corn, the combination of the farming system and the climate poses less of a risk than wheat production in Australia, which is closer to its limits of viability today. Farmers can prepare for changes already underway, with more projected for the future, but the larger the changes experienced, the more difficult they will be to manage. This reinforces the climate change adage to “manage what we can’t avoid and avoid what we can’t manage” by reducing the emissions of greenhouse gases. The research was conducted by an international team led by Dr. Caroline Ummenhofer of the Woods Hole Oceanographic Institute in Massachusetts, USA. We studied historical yield and climate records to understand the effects of climate on crop yields in the past, and then projected how this is likely to change in the future. To do so, we used the latest climate models (six simulations developed by groups in France, Japan, the US, and Australia) and scenarios of future greenhouse gas emissions (a business-as-usual scenario of continuing high emissions of greenhouse gases, known as RCP 8.5, and a moderate stabilization scenario called RCP 4.5, which would involve emissions stabilizing at around 5 gigatons of carbon per year by the end of the century, compared with current emissions around 9 gigatons). By Marius Sandvoll Weschke and Kimberly Nicholas The climate summit that will begin in Paris next week will attract delegates from more than 190 countries, all with the goal of signing an agreement to avoid the worst impacts of climate change. The whole world will have their eyes on Paris when the 21st Conference of the Parties (COP) is underway, and the pressure on the politicians and decision makers going to Paris is high, not only from their own governments and voters, but from many other parts of society. In particular, in recent months there has been a groundswell of statements on climate change from across sectors in society, from religious leaders, businesses, and scientific groups, to non-governmental organizations and national leaders. These statements outline the most important issues that their authors feel the Paris meeting should address. Among the statements gaining the most attention the last year an encyclical from Pope Francis, urging the world’s 1.2 billion Catholics to join the fight against climate change. A statement like this resonates far beyond the religious community, and it was portrayed in the media as a signal to politicians to pick up the pace on climate action. While the high-level United Nations process can make climate policy seem like a distant issue, these statements show that a vast number of people and interest groups are keenly invested in the process. We were interested in the key messages these diverse groups agree on. To analyze this, we analyzed 11 statements on climate change from religious groups, science, businesses, NGOs and the G7. The goal was to find out if the different groups speak the same language. That is, we wanted to see if the most commonly used words in the different statements overlap, which would indicate similar perspectives on the issue of climate change. We used an online word cloud generator to identify the 25 most commonly used words in each statement, and looked for words that were shared between statements (Figure 1). 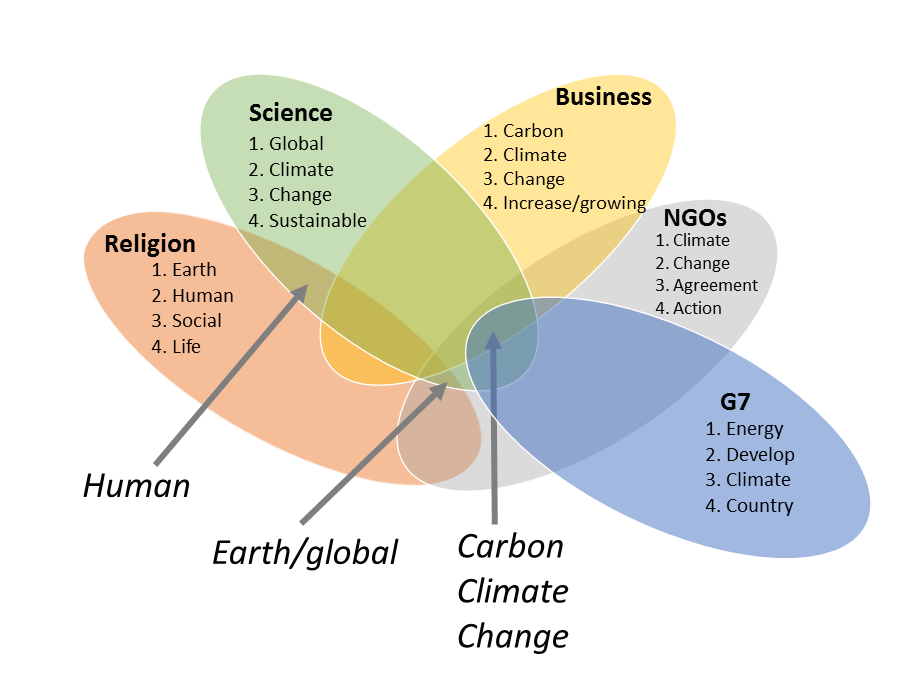 Figure 1: Quantitative word analysis of 11 climate change statements originating from statements in five categories: four religious statements, three scientific, two business, one NGO consortium, and the G7 leaders. The four most commonly used words within each category are shown in each bubble, while the words that are overlapping between categories are marked with arrows. See footnote (1) for list of statements analyzed. Our analysis showed the words ‘carbon’, ‘climate’, and ‘change’ are all among the most used words for science, business, NGOs and G7, but not the religious statements, indicating a technical and problem-oriented approach among these groups. The word ‘Earth’/’global’ shared similar ground between religion, science and NGOs, indicating a political or philosophical outlook shared by these groups. Surprisingly, religion and science shared the word ‘human’ among their most used words, indicating a shared worldview seeing people as both the cause and the solution to the problem of climate change. In the beginning of the study we hypothesized that there would be words that would be found among all categories, but as the figure shows, there was no word that all five sectors used most commonly. However, the existence of these statements still sends a strong message that the international community - from religious groups to businesses and from scientists to NGOs - wants their leaders and policymakers to focus on stronger action, leading to solutions to tackle human-induced carbon emissions driving climate change in Paris. At the same time, the religious perspectives highlight the social values these choices represent, and how fundamental they are to our way of life. Statements Analyzed: Religious statements: Pope Francis’ Encyclical (http://tinyurl.com/ptcm9bz), A Buddhist Declaration on Climate Change (http://tinyurl.com/p9ge6xj), Islamic Climate Declaration (http://tinyurl.com/nqg98o7), A Rabbinic Letter on the Climate Crisis (http://tinyurl.com/qcyzmqg). Scientific statements: Earth Statement (http://tinyurl.com/nqw7d9b), Our Common Future under Climate Change (http://tinyurl.com/q5oy4x5), Planet under Pressure (http://tinyurl.com/7mvc9vq) Business statements: Institutional Investment Group on Climate Change (http://tinyurl.com/oaf6ooz), The World Bank: Putting a Price on Carbon (http://tinyurl.com/nrkagpx). NGO statement: Paris 2015: getting a global agreement on climate change (http://tinyurl.com/mhbqt2r). National leaders: Leaders’ Declaration G7 Summit 2015 (http://tinyurl.com/nmuagfd) This post summarizes research by Marius Sandvoll Weschke and Kimberly Nicholas presented at the Transformations conference held in Stockholm, October 2015.
Read an interview with Marius about this work in the Finnish newspaper Kyrkpressen here.
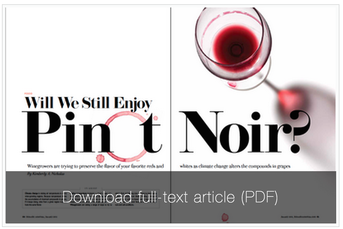
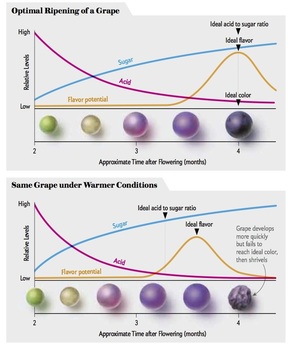
While research is ongoing to try to understand how the more than 1,000 aroma compounds identified in wine affect our flavor perception, many compounds appear to be sensitive to climate, particularly in the later stages of grape ripening. Some desirable compounds like rotundone, which gives Syrah its typical black pepper aroma, appear to accumulate more at cooler sites and in cooler years, so warmer-climate Syrahs have less of this character. 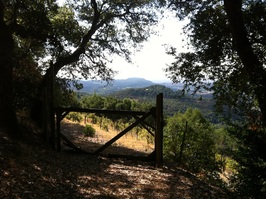 My parents' vineyard in the hills above Sonoma. My parents' vineyard in the hills above Sonoma. Winegrowers and winemakers have many options to adapt to warming climates. Growers are experimenting with new wine regions, cooler locations within existing regions (such as moving from warmer valleys to cooler hillsides), trying new varieties better suited to warmer conditions, and farming methods that provide more shade on the fruit. Winemakers can use approaches including alcohol removal and acid addition to improve wine balance. Steps like these can go a long way towards preserving great wines under climate change. Ultimately, though, there are economic and biophysical limits to this adaptation. There are also cultural limitations: the know-how and sense of place that growers cultivate along with the land over generations of family farming is not easily moved, and consumers have come to expect a distinct flavor profile from wines from their preferred regions. Great wine is grown, not made; it reflects its place of origin. If the climate changes even a little bit, local knowledge and skills that have taken generations to hone can become less relevant, even in familiar territory. But the changes we’re facing in climate are not small ones. Under our current trajectory of fossil fuel use, scientists project that the global average temperature will increase 4.7 to 8.6°F (2.6 to 4.8°C) over the next few generations. Even the low end of this range would be the difference in annual average temperatures between the winegrowing regions of Napa and Fresno today. Currently, Cabernet grapes from cooler Napa are worth more than 10 times as much as those from Fresno- a difference of over $3,000 a ton. Wine illustrates our deep reliance on nature to provide us with everything we need to live, and many of the things that make life worth living. We are in a moment of critical climate choices. Choosing to limit climate change gives us more options for a more healthy, thriving, fair, and delicious world- including more of the traditional flavors of your favorite wines.
What if the secret to writing successful research proposals were to go back to the basic lessons your fourth grade teacher taught you about writing? It can't possibly be that simple, can it?
I just had a lovely dinner with my smart & wise friend Harriet Bulkeley. One of many good pieces of advice she gave me (this one picked up by joining a conversation she overheard on a train!) is to think over the answer to four things before beginning a research proposal or project: 1. What do I want to do? 2. Who do I want to do it with? 3. Where do I want to do it? 4. Why do I want to do it? I said this sounded like a great way to teach research design to students, but as we discussed more, I realized researchers at every level could probably benefit from this advice, myself included. She noted that many people can only answer one of these questions when they approach a university research office or a funding agency with a research idea. They might hope that the answers will get clarified in working through the project, but this is rarely the case. In projects that haven't clarified these key points at the outstart are likely to get bogged down in these issues through the course of research. A great reminder to think through the basics before committing your precious and limited time.
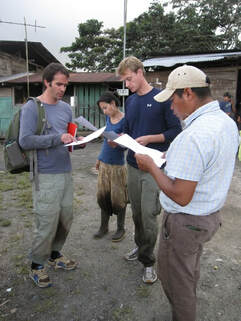
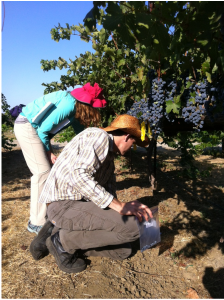
The end is drawing near for our first field season for the Vitis project, led by Lizzie Wolkovich at Harvard, where we're looking at the timing of development (phenology) for over 100 different varieties of grapevines at the teaching vineyard at the University of California- Davis. Sampling from a common garden like this lets us control for climate, soil, management, and other variables, so we can learn more about how the vines respond to the environment. Over 100 varieties of the world's most commercially important grapevines are planted side-by-side here in this one vineyard; my mom calls it the "Noah's Ark of grapevines." My collaborator Dylan Burge, from the California Academy of Sciences (above left), will be doing genomic analyses to search for the genetic basis of this environmental response. We hope that the results will help us identify relationships that could be useful for adapting viticulture to climate change, perhaps better matching the development and ripening of the vine with a changing environment.
We've already made observations on earlier phenological stages (budburst, where the vines first start growing in the spring; bloom, when the flowers that will develop into individual berries are visible; and veraison, when the berries start changing color and accumulating sugar). The last stage to monitor is ripening, which we're measuring now by taking berry samples in the field and analyzing them for their sugar content in the lab. Different varieties can ripen at very different rates, and achieve different sugar levels at ripeness; generally cool-climate grapes like Riesling ripen earlier and at lower sugar levels than warm-climate ones like Tempranillo. After Lizzie did a heroic singlehanded field campaign for the first sampling date a few weeks ago, it took three of us (Dylan, Teri Barry, and me) to match her for the second round! It was great to get out in the vineyard for a morning and make a small contribution on the ground to the fieldwork that Dylan and Lizzie have been running while I contribute from afar in Sweden. |
Categories
All
Archives
November 2023
|
KIM NICHOLAS
 RSS Feed